Calculates DPIT residuals with model for two-part models with semicontinuous outcomes.
For each component, dpit_2pm accepts either a fitted model or supplied
probability integral transforms: exactly one of model0 and part0, and exactly one of
model1 and part1.
Arguments
- model0
Model object for 0 outcomes (e.g., logistic regression)
- model1
Model object for the continuous part (gamma regression)
- y
Semicontinuous outcomes.
- part0
Alternative argument to
model0. One can supply the sequence of probabilities \(P(Y_i=0),~i=1,\ldots,n\).- part1
Alternative argument to
model1. One can fit a regression model on the positive data and supply their probability integral transforms. Note that the length ofpart1is the number of positive values inyand can be shorter thanpart0.
Details
For formulation details on semicontinuous outcomes, see dpit.
In two-part models, the probability of zero can be modeled using a logistic regression, model0,
while the positive observations can be modeled using a gamma regression, model1.
Users can choose to use different models and supply the resulting probabilities of zero and probability integral transforms.
part0 should be the sequence of fitted probabilities of zeros \(\hat{p}_0(\mathbf{X}_i) ,~i=1,\ldots,n\).
part1 should be the probability integral transform of the positive part \(\hat{G}(Y_i|\mathbf{X}_i)\).
Note that the length of part1 is the number of positive values in y and can be shorter than part0.
Exactly one of model0 and part0, and exactly one of model1 and
part1, must be supplied. Model and probability inputs may be mixed.
Use residuals(), summary(), and plot() on the returned object to select
the residual scale, summarize the values, and draw the QQ plot.
Examples
library(MASS)
n <- 500
beta10 <- 1
beta11 <- -2
beta12 <- -1
beta13 <- -1
beta14 <- -1
beta15 <- -2
x11 <- rnorm(n)
x12 <- rbinom(n, size = 1, prob = 0.4)
p1 <- 1 / (1 + exp(-(beta10 + x11 * beta11 + x12 * beta12)))
lambda1 <- exp(beta13 + beta14 * x11 + beta15 * x12)
y2 <- rgamma(n, scale = lambda1 / 2, shape = 2)
y <- rep(0, n)
u <- runif(n, 0, 1)
ind1 <- which(u >= p1)
y[ind1] <- y2[ind1]
# models as input
mgamma <- glm(y[ind1] ~ x11[ind1] + x12[ind1], family = Gamma(link = "log"))
m10 <- glm(y == 0 ~ x12 + x11, family = binomial(link = "logit"))
dpit.model <- dpit_2pm(model0 = m10, model1 = mgamma, y = y)
resid.model <- residuals(dpit.model, scale = "normal")
summary(dpit.model, scale = "normal")
#> Summary of DPIT residuals
#>
#> Model calls:
#> model0:
#> glm(formula = y == 0 ~ x12 + x11, family = binomial(link = "logit"))
#> model1:
#> glm(formula = y[ind1] ~ x11[ind1] + x12[ind1], family = Gamma(link = "log"))
#>
#> Residual scale: normal
#> Sample size: 500
#>
#> Min. 1st Qu. Median Mean 3rd Qu. Max.
#> -3.124463459 -0.675574534 0.002497113 0.002778959 0.680683613 3.441292442
#> Std. Dev.
#> 1.009393758
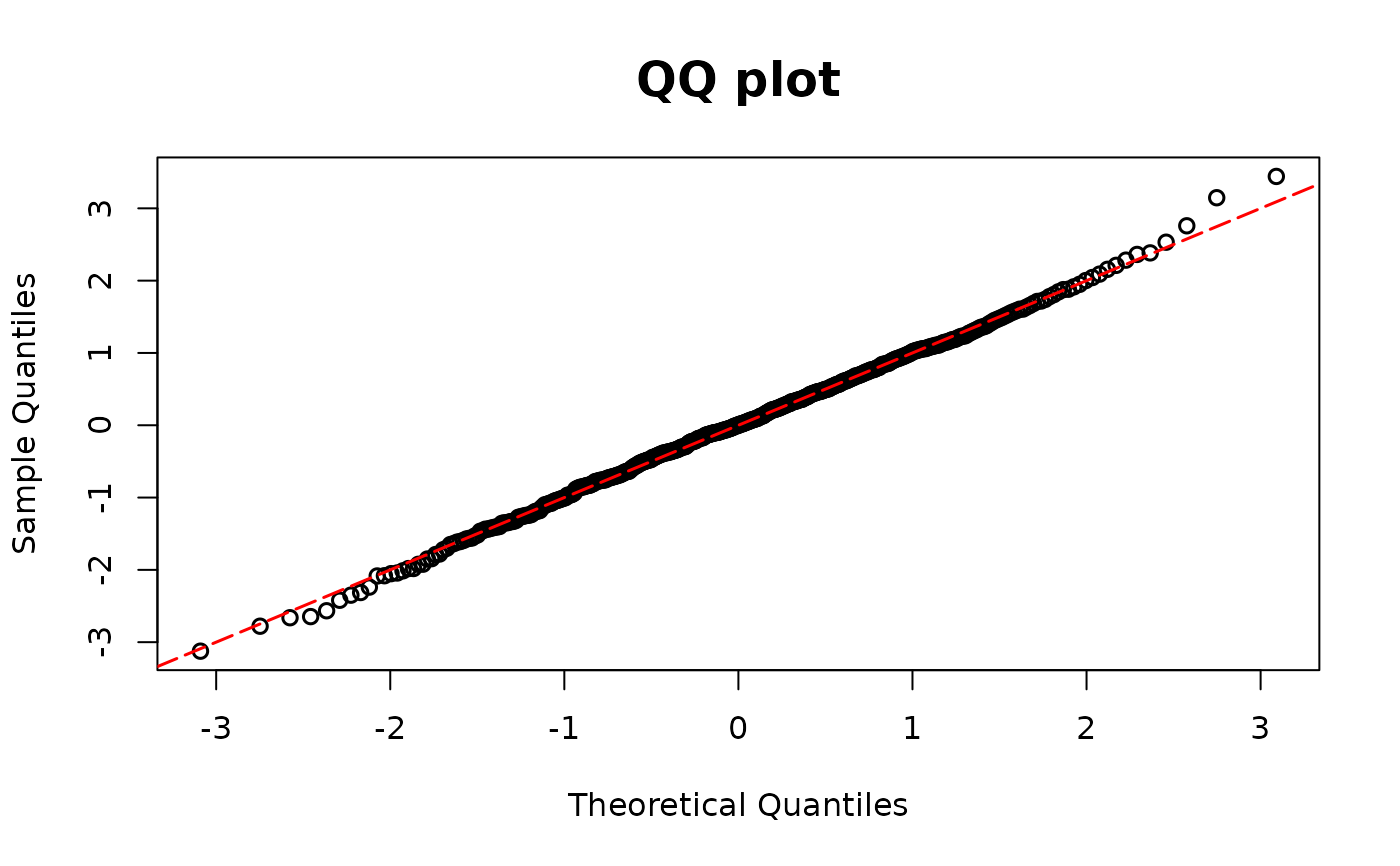
plot(dpit.model, scale = "normal")
 # PIT as input
cdfgamma <- pgamma(y[ind1],
scale = mgamma$fitted.values * gamma.dispersion(mgamma),
shape = 1 / gamma.dispersion(mgamma)
)
p1f <- m10$fitted.values
dpit.pit <- dpit_2pm(y = y, part0 = p1f, part1 = cdfgamma)
resid.pit <- residuals(dpit.pit, scale = "uniform")
summary(dpit.pit, scale = "uniform")
#> Summary of DPIT residuals
#>
#> Residual scale: uniform
#> Sample size: 500
#>
#> Min. 1st Qu. Median Mean 3rd Qu. Max.
#> 0.0008906482 0.2496560302 0.5009961817 0.5022602395 0.7519641402 0.9997105288
#> Std. Dev.
#> 0.2873310116
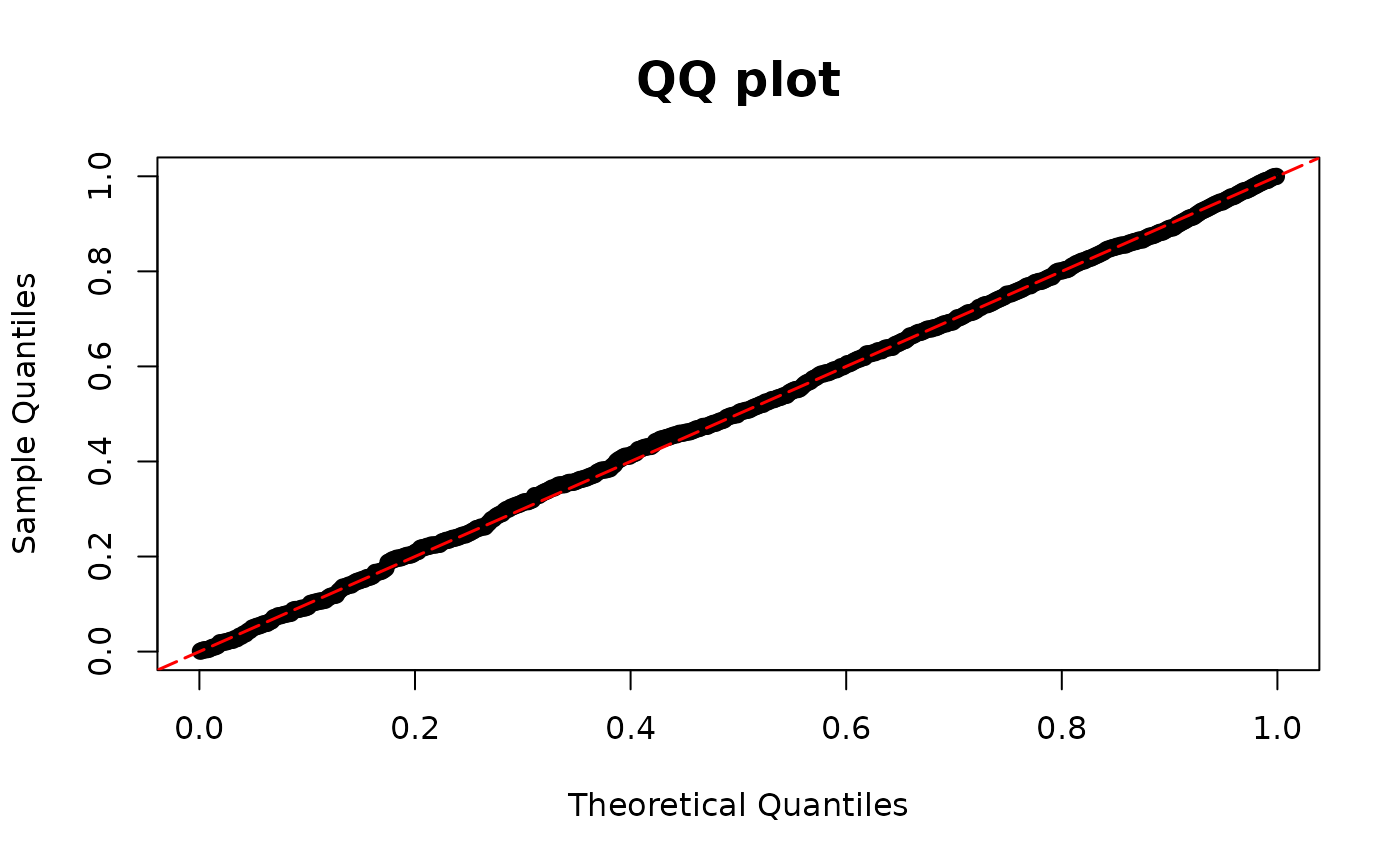
plot(dpit.pit, scale = "uniform")
# PIT as input
cdfgamma <- pgamma(y[ind1],
scale = mgamma$fitted.values * gamma.dispersion(mgamma),
shape = 1 / gamma.dispersion(mgamma)
)
p1f <- m10$fitted.values
dpit.pit <- dpit_2pm(y = y, part0 = p1f, part1 = cdfgamma)
resid.pit <- residuals(dpit.pit, scale = "uniform")
summary(dpit.pit, scale = "uniform")
#> Summary of DPIT residuals
#>
#> Residual scale: uniform
#> Sample size: 500
#>
#> Min. 1st Qu. Median Mean 3rd Qu. Max.
#> 0.0008906482 0.2496560302 0.5009961817 0.5022602395 0.7519641402 0.9997105288
#> Std. Dev.
#> 0.2873310116
plot(dpit.pit, scale = "uniform")