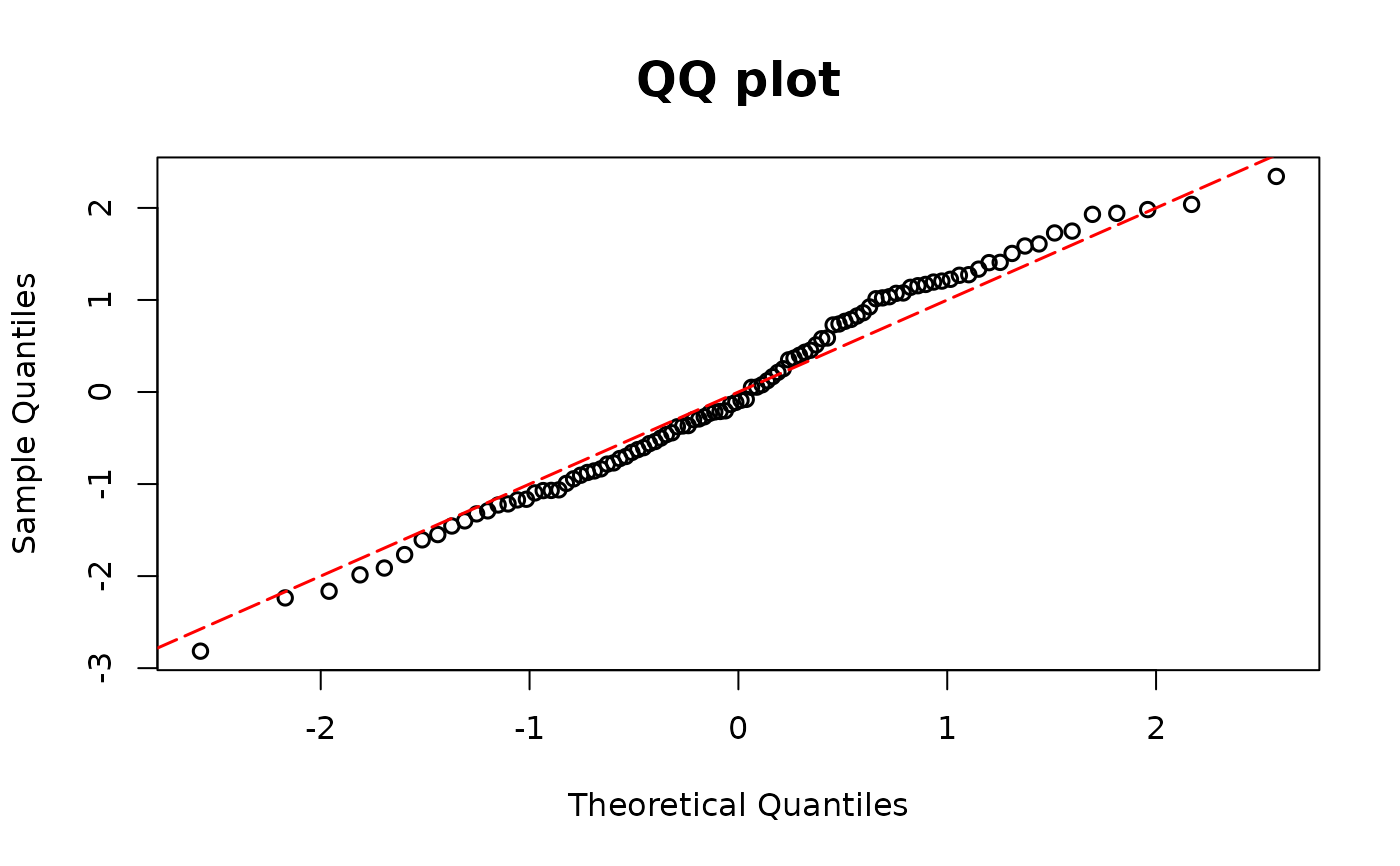
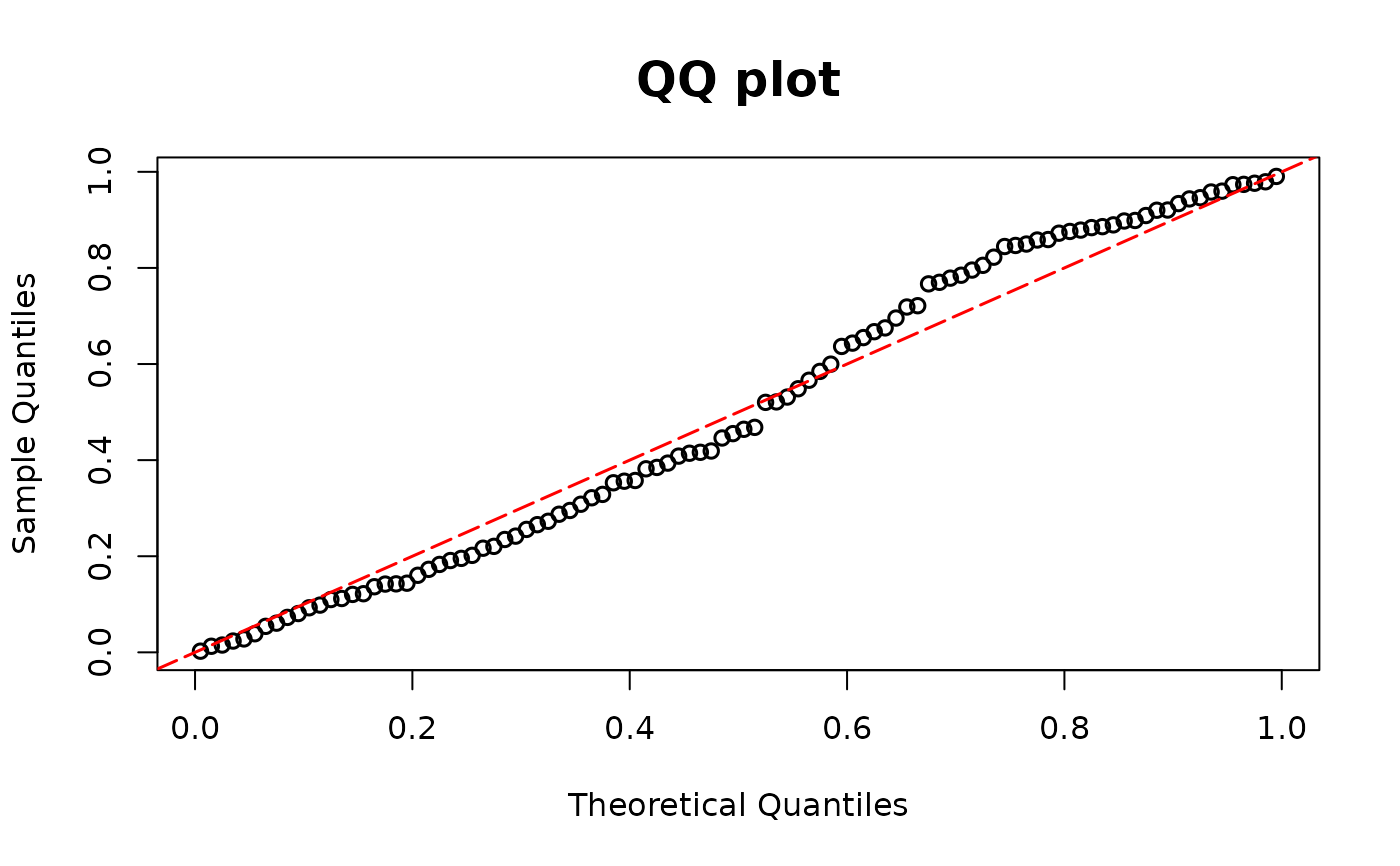
Makes a QQ-plot of the DPIT residuals calculated from resid_disc(), resid_semiconti() or resid_zeroinfl().
The plot should be close to the diagonal if the model is correctly specified.
Note that this function does not return residuals. To get both residuals and QQ-plot,
use resid_disc(), resid_semiconti() and resid_zeroinfl().
Arguments
- model
Fitted model object (e.g.,
glm(),glm.nb(),zeroinfl(), andpolr())- scale
You can choose the scale of the residuals between
normalanduniformscales. The sample quantiles of the residuals are plotted against the theoretical quantiles of a standard normal distribution under the normal scale, and against the theoretical quantiles of a uniform (0,1) distribution under the uniform scale. The defalut scale isnormal.